|
Page d'accueil
Maplets
<< Page précédente
Page suivante >>
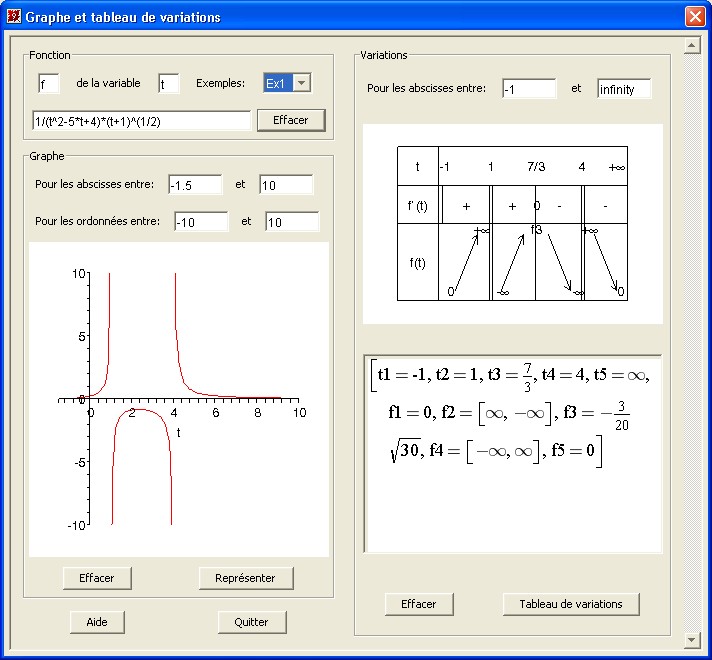
Graphe
et tableau de variations d'une fonction f
© Alain Le Stang - "Apprendre Maple" - 2004
Sélectionner Edit/Execute/Worksheet ou cliquer le bouton !!! pour
exécuter ce Maplet.
| >
|
restart:
with(Maplets[Elements]): with(plots): |
Warning, the
name changecoords has been redefined
| > |
tab_var:=proc(f,x::name,fonc::name,a,b)
global liste;
local liste_X,signe_derivee,liste_def,texte,fleche,traits_verticaux,
N,X,Y,S,Lf,largeur,hauteur,bordures,doubles_traits,fleches,limites,colonne1,ligne1,signes,h,i,l,w;
#########################################################
####
procédure liste_X
####
#########################################################
liste_X:=proc(f,x::name,a,b)
local i,j,DF,F,L,M,N,S;
L:={a,b};
F:=[singular(f(x))]:
for i to nops(F) do
L:=L union {rhs(op(F[i]))}
end do;
DF:=[singular(D(f)(x))]:
for i to nops(DF) do
L:=L union {rhs(op(DF[i]))}
end do;
S:=[solve(D(f)(x),x)]:
if S=[x] then S:=[a,b] end if;
for i to nops(S) do
L:=L union {S[i]}
end do;
L:=sort(convert(L,list));
M:=NULL;
for i to nops(L) do
if evalb(evalf(L[i])>=evalf(a) and evalf(L[i])<=evalf(b)) then M:=M,L[i]
end if
end do;
M:=sort(map(evalf,convert({M},list))):
N:=NULL;
for i to nops(M) do
for j to nops(L) do
if evalb(evalf(L[j])=M[i]) then N:=N,L[j] end if;
end do;
end do;
[N]
end proc:
#########################################################
####
procédure signe_derivee
####
#########################################################
signe_derivee:=proc(f,L::list,X::list)
local i,j,M,s;
M:=NULL;
for i to nops(X)-1 do
if X[i]=-infinity then
s:=evalf(simplify(D(f)(X[i+1]-1)))
elif X[i+1]=infinity then
s:=evalf(simplify(D(f)(X[i]+1)))
else s:=evalf(simplify(D(f)((X[i]+X[i+1])/2)))
end if;
if s=0 then M:=M,0 else M:=M,sign(s) end if;
end do;
M:=[M]:
for i from nops(M) to 2 by -1 do
if sign(M[i-1])=sign(M[i]) then
if L[i][2]=true then M[i-1]:=M[i-1]+M[i] end if
end if;
end do;
for i to nops(M) do
if is(M[i],integer) and abs(M[i])>1 then
for j from i+1 to i+abs(M[i])-1 do
if M[i]>0 then M[j]:=evalf((j-i)/(abs(M[i])),2)
else M[j]:=-(1+evalf((j-i)/M[i],2)) end if;
end do
end if;
end do;
M
end proc:
#########################################################
####
procédure list_def
####
#########################################################
liste_def:=proc(f,L::list)
local i,M,N,b,c;
M:=NULL:
for i in L do
b:=true;c:=true;N:=NULL:
try
simplify(f(i));
catch:
b:=false;
end try;
N:=N,i,b;
try
simplify(D(f)(i));
catch:
c:=false;
end try;
N:=N,c;
M:=M,[N]
end do;
[M];
end proc:
#########################################################
####
procédure texte
####
#########################################################
texte:=proc(absc,ord,txt,police,taille,drapeau,indice)
if txt=-infinity then
textplot([absc,ord,"-"],font=[police,taille]),textplot([absc+1.2,ord,"¥"],font=[SYMBOL,taille])
elif txt=infinity then
textplot([absc,ord,"+¥"],font=[SYMBOL,taille])
elif drapeau=0 then
textplot([absc,ord,txt],font=[police,taille])
else
if is(txt,rational) then
textplot([absc,ord,txt],font=[police,taille])
else
textplot([absc,ord,cat(drapeau,indice)],font=[police,taille])
end if;
end if;
end proc:
#########################################################
####
procédure fleche
####
#########################################################
fleche:=proc(P1,P2)
local fl;
fl:=proc(x1,y1,x2,y2,a)
local d,x3,y3,x4,y4,x5,y5;
d:=evalf(sqrt((x2-x1)^2+(y2-y1)^2)):
x3:=evalf(x1+(d-a)/d*(x2-x1)):y3:=evalf(y1+(d-a)/d*(y2-y1)):
x4:=evalf(x2+0.5*(sqrt(3)*(x3-x2)-y3+y2)):
y4:=evalf(y2+0.5*(x3-x2+sqrt(3)*(y3-y2))):
x5:=evalf(x2+0.5*(sqrt(3)*(x3-x2)+y3-y2)):
y5:=evalf(y2+0.5*(-x3+x2+sqrt(3)*(y3-y2))):
plot([[x1,y1],[x2,y2],[x4,y4],[x2,y2],[x5,y5]],color=black)
end proc:
fl(P1[1],P1[2],P1[1]+P2[1],P1[2]+P2[2],1.5)
end proc:
#########################################################
####
procédure principale
####
#########################################################
X:=liste_X(f,x,a,b): #print(`liste_X `=X):
Lf:=liste_def(f,X): #print(`liste_def `=Lf):
S:=signe_derivee(f,Lf,X): #print(`signe_derivee `=S):
largeur:=10:hauteur:=5:
w:=nops(X)*largeur:
# affichage des bordures du tableau
bordures:=[
plot([[0,0],[w,0],[w,4*hauteur],[0,4*hauteur],[0,0],[0.9*largeur,0],[0.9*largeur,4*hauteur]],color=black),
plot([[0,3*hauteur],[w,3*hauteur]],color=black),plot([[0,2*hauteur],[w,2*hauteur]],color=black)]:
# affichage des traits verticaux de séparation
traits_verticaux:=NULL:
for i to nops(S) do
if is(S[i],integer) then
traits_verticaux:=traits_verticaux,plot([[(i+abs(S[i]))*largeur,0],[(i+abs(S[i]))*largeur,3*hauteur]],color=black)
end if;
end do;
traits_verticaux:=[traits_verticaux]:
# affichage des doubles traits verticaux aux points où f (resp. f') n'est
pas définie
doubles_traits:=NULL:
for i to nops(Lf) do
if i=1 then l:=largeur*0.925 else l:=largeur end if;
if Lf[i][2]=false then
doubles_traits:=doubles_traits,plot([[i*l+0.6,0],[i*l+0.6,2*hauteur]],color=black)
end if;
if Lf[i][3]=false then doubles_traits:=doubles_traits,plot([[i*l+0.6,2*hauteur],[i*l+0.6,3*hauteur]],color=black)
else
if simplify(D(f)(Lf[i][1]))=0 and abs(Lf[i][1])<>infinity then doubles_traits:=doubles_traits,texte(l*i,2*hauteur+hauteur/2,0,HELVETICA,10,0,0),
plot([[l*i,2*hauteur],[l*i,3*hauteur]],color=black)
end if
end if
end do;
doubles_traits:=[doubles_traits]:
# affichage des textes dans la première colonne : "x" , "f(x)" , "f'(x)"
colonne1:=[texte(0.45*largeur,3*hauteur+hauteur/2,x,HELVETICA,10,0,0),
texte(0.45*largeur,2*hauteur+hauteur/2,cat(fonc,"`(",x,")"),HELVETICA,10,0,0),
texte(0.45*largeur,hauteur,cat(fonc,`(`,x,`)`),HELVETICA,10,0,0)]:
# affichage des valeurs de x dans la première ligne du tableau
ligne1:=NULL:
for i to nops(X) do
if X[i]=-infinity then
ligne1:=ligne1,texte(largeur/20+largeur,3*hauteur+hauteur/2,X[i],HELVETICA,10,0,0)
elif X[i]=infinity then ligne1:=ligne1,texte(w-largeur/4,3*hauteur+hauteur/2,X[i],SYMBOL,10,0,0)
else
ligne1:=ligne1,texte(largeur*i,3*hauteur+hauteur/2,X[i],HELVETICA,10,x,i)
end if
end do:
ligne1:=[ligne1]:
# affichage des signes de la dérivée dans la seconde ligne et
# affichage des flèches associées dans la troisième ligne
signes:=NULL:fleches:=NULL:
for i to nops(S) do
if S[i]<0 then
signes:=signes,texte(largeur/2+largeur*i,2*hauteur+hauteur/2,"-",HELVETICA,10,0,0):
if is(S[i],integer) then fleches:=fleches,fleche([largeur*i+largeur/4,2*hauteur-hauteur/4],
[largeur*(abs(S[i])-1)+largeur/2,-2*hauteur+hauteur/2] )
end if;
elif S[i]=0 then
signes:=signes,texte(largeur/2+largeur*i,2*hauteur+hauteur/2,"0",HELVETICA,10,0,0):
fleches:=fleches,fleche([largeur*i+largeur/4,hauteur],[largeur*(abs(S[i])-1)+largeur/2,0]
)
else
signes:=signes,texte(largeur/2+largeur*i,2*hauteur+hauteur/2,"+",HELVETICA,10,0,0):
if is(S[i],integer) then
fleches:=fleches,fleche([largeur*i+largeur/4,hauteur/4],[largeur*(abs(S[i])-1)+largeur/2,2*hauteur-hauteur/2]
)
end if;
end if;
end do;
signes:=[signes]:
fleches:=[fleches]:
# détermination des valeurs de f(x) ou des limites (à gauche ou à droite)
Y:=NULL:
for i to nops(Lf) do
if i=1 then
Y:=Y,[simplify(limit(f(x),x=Lf[i][1],right))]
elif i=nops(Lf) then
Y:=Y,[simplify(limit(f(x),x=Lf[i][1],left))]
else
if Lf[i][2]=true then Y:=Y,[simplify(limit(f(x),x=Lf[i][1]))]
else Y:=Y,[simplify(limit(f(x),x=Lf[i][1],left)),simplify(limit(f(x),x=Lf[i][1],right))]
end if
end if;
end do;
Y:=[Y]:
# affichage des valeurs de f(x) ou des limites aux extrémités des flèches
limites:=NULL:
for i to nops(Y) do
if i=1 then
if S[i]<0 then
limites:=limites,texte(largeur+largeur/8,2*hauteur-hauteur/8,Y[i][1],HELVETICA,10,fonc,i)
else
limites:=limites,texte(largeur+largeur/8,hauteur/4,Y[i][1],HELVETICA,10,fonc,i);
end if;
elif i=nops(Y) then
if S[i-1]<0 then
limites:=limites,texte(i*largeur-1.8,hauteur/4,Y[i][1],HELVETICA,10,fonc,i)
else
limites:=limites,texte(i*largeur-1.8,2*hauteur-hauteur/8,Y[i][1],HELVETICA,10,fonc,i)
end if;
else
if nops(Y[i])=2 then
if S[i-1]<0 then
limites:=limites,texte(i*largeur-1.8,hauteur/4,Y[i][1],HELVETICA,10,fonc,i)
else
limites:=limites,texte(i*largeur-1.8,2*hauteur-hauteur/8,Y[i][1],HELVETICA,10,fonc,i)
end if;
if S[i]<0 then
limites:=limites,texte(i*largeur+1.8,2*hauteur-hauteur/8,Y[i][2],HELVETICA,10,fonc,i)
else
limites:=limites,texte(i*largeur+1.8,hauteur/4,Y[i][2],HELVETICA,10,fonc,i)
end if;
else # nops(Y[i])=1
if S[i]<0 then
if is(S[i],integer) then h:=2*hauteur-hauteur/8 else h:=-2*hauteur*S[i]
end if;
end if;
if S[i]>0 then
if is(S[i],integer) then h:=hauteur/4 else h:=2*hauteur*S[i] end if;
end if;
limites:=limites,texte(i*largeur,h,Y[i][1],HELVETICA,10,fonc,i)
end if;
end if;
end do:
limites:=[limites]:
# valeurs particulières de x et des images f(x):
for i to nops(Y) do
if nops(Y[i])=1 then Y[i]:=op(Y[i]) end if
end do;
liste:=[seq(x||i=Lf[i][1],i=1..nops(Lf)),seq(fonc||i=Y[i],i=1..nops(Y))]:
# tracé du tableau des variations de f
display(bordures,traits_verticaux,doubles_traits,colonne1,ligne1,signes,fleches,limites,axes=none,
scaling=unconstrained)
end proc:
|
| |
|
| >
|
tab_var(t->1/(t^2-5*t+4)*sqrt(t+1),t,y,-1,infinity);op(liste); |
![[Plot]](images/tabvar.htm_1.gif)
![t1 = -1, t2 = 1, t3 = 7/3, t4 = 4, t5 = infinity, y1 = 0, y2 = [infinity, -infinity], y3 = -3/20*30^(1/2), y4 = [-infinity, infinity], y5 = 0](images/tabvar.htm_2.gif)
| >
|
exemples:=[
[1/(t^2-5*t+4)*sqrt(t+1),t,f,-1,infinity,-1.5,10,-10,10],
[(x^2+1)/(2*x^2+x-4),x,g,-infinity,infinity,-10,10,-5,5],
[-x^4+2*x^3+3*x^2-4*x+5,x,h,-infinity,infinity,-5,5,-10,10], [exp(-u)/(u^2-1),u,i,-infinity,infinity,-5,2,-20,20],
[2*t/(t^2-4)+1/2*ln(abs((2+t)/(2-t))),t,j,-infinity,infinity,-10,10,-10,10]
]:
|
| >
|
MajExemples:=proc()
global exemples;
local v,ex;
v:=Maplets:-Tools:-Get('DDB'('value')):
if v="Ex1" then ex:=exemples[1]
elif v="Ex2" then ex:=exemples[2]
elif v="Ex3" then ex:=exemples[3]
elif v="Ex4" then ex:=exemples[4]
else ex:=exemples[5]
end if;
EffacerCourbe(); EffacerTabVar();
Maplets:-Tools:-Set('ExpFonc'('value')=ex[1]):
Maplets:-Tools:-Set('NomVar'('value')=ex[2]):
Maplets:-Tools:-Set('NomFonc'('value')=ex[3]):
Maplets:-Tools:-Set('XVmin'('value')=ex[4]):
Maplets:-Tools:-Set('XVmax'('value')=ex[5]):
Maplets:-Tools:-Set('Xmin'('value')=ex[6]):
Maplets:-Tools:-Set('Xmax'('value')=ex[7]):
Maplets:-Tools:-Set('Ymin'('value')=ex[8]):
Maplets:-Tools:-Set('Ymax'('value')=ex[9]):
end proc:
|
| >
|
TabVarMaplet := Maplet(
Window( 'title'="Graphe et tableau de variations",
BoxRow('vscroll'='always',
BoxRow(border=false, inset=0,
[ BoxColumn(border=true, inset=0, 'caption'="Fonction",
[TextField['NomFonc']("f",width=2), "de la variable", TextField['NomVar']("x",width=2),"Exemples:",DropDownBox['DDB']("Ex1",[Ex1,Ex2,Ex3,Ex4,Ex5],
'onchange'='majEx')],
[ TextField['ExpFonc'](),Button("Effacer",'onclick'='effFonc') ]
),
BoxColumn(border=true, inset=0, 'caption'="Graphe",
["Pour les abscisses entre:",
TextField['Xmin'](width=5), "et", TextField['Xmax'](width=5)],
["Pour les ordonnées entre:",
TextField['Ymin'](value="-10",enabled=true,width=5),"et",
TextField['Ymax'](value="10",enabled=true,width=5)],
Plotter['PL1'](width=300,height=315),
[Button("Effacer", 'onclick'='effCourbe'),
Button['B1']("Représenter", Action(
Evaluate( 'PL1' = 'plot(ExpFonc,NomVar=Xmin..Xmax,discont=true,view=[Xmin..Xmax,Ymin..Ymax])'
)
)
)]
),
[Button("Aide", RunDialog('MD1')), Button("Quitter", Shutdown())]
]
),
[ BoxColumn(border=true, inset=0, 'caption'="Variations",
["Pour les abscisses entre:",
TextField['XVmin'](width=5),"et",TextField['XVmax'](width=5)],
Plotter['PL2'](width=300,height=200),
MathMLViewer['MMLV'](width=300,height=200),
[Button("Effacer", 'onclick'='effTabVar'),
Button['B2']("Tableau de variations", Action(
Evaluate( 'PL2' = 'tab_var(unapply(ExpFonc,NomVar),NomVar,NomFonc,XVmin,XVmax)'),
Evaluate( 'MMLV' = 'MathML[Export](liste)')
))]
)
]
)),
MessageDialog['MD1']( " © Alain Le Stang - ""Apprendre Maple"" -
2004\n\nCe maplet donne la représentation
graphique d'une fonction\n et permet de visualiser son tableau de
variations.", 'type'='information' ),
Action['effFonc'](
SetOption('NomFonc'="f"), SetOption('NomVar'="x"),
SetOption('ExpFonc'=""), SetOption('DDB'="Ex1")
),
Action['effCourbe'](
SetOption('Xmax'=""), SetOption('Ymax'="10"), SetOption('Xmin'=""),
SetOption('Ymin'="-10"),
Evaluate( 'PL1' = 'plot(undefined,x=-10..10,axes=NONE)')
),
Action['effTabVar'](
SetOption('XVmax'=""), SetOption('XVmin'=""), SetOption('MMLV'=""),
Evaluate( 'PL2' = 'plot(undefined,x=-10..10,axes=NONE)' )
),
Action['majEx'](
),
Action['majEx'](
Evaluate('function'="MajExemples"),
Evaluate( 'PL1' = 'plot(ExpFonc,NomVar=Xmin..Xmax,discont=true,view=[Xmin..Xmax,Ymin..Ymax])'
),
Evaluate( 'PL2' = 'tab_var(unapply(ExpFonc,NomVar),NomVar,NomFonc,XVmin,XVmax)'),
Evaluate( 'MMLV' = 'MathML[Export](liste)')
)
):
|
| >
|
Maplets[Display](TabVarMaplet);
|
| |
 |
|